告别AI黑盒:Prompt、Tool Call、Trace、Token全链路可观测实战
Knock 2026-10-29 07:15 广东
以下文章来源于:ThinkingAgent
ThinkingAgent分享AI Native时代最新技术和落地实践。

你的AI系统,为何会时好时坏?
你的 AI 系统上线了,用户反馈「有时候好用,有时候不好用」。
你想排查问题,却发现:
Prompt 是什么?不知道,没记录
调了哪些工具?不知道,没日志
完整调用链路?不知道,黑盒
Token 花了多少钱?月底账单才知道
这不是个例。这是 2026 年大多数 AI 系统的现状。
传统软件有成熟的监控体系(APM、日志、指标、链路追踪),但 AI 系统——特别是基于 LLM 的系统——有其独特的复杂性:
不确定性:同样的输入,可能产生不同的输出
多步骤:一个用户请求可能触发 10+ 次 LLM 调用
工具链:Agent 会调用外部 API、数据库、搜索引擎
成本不透明:Token 消耗、API 调用费用难以预估
这就是为什么我们需要 AI 可观测性(AI Observability)。
一、什么是 AI 可观测性?
AI 可观测性不是简单的日志记录。它是理解 AI 系统内部状态和行为的完整能力。
类比传统软件:
传统 APM:监控 HTTP 请求 → 数据库查询 → 响应
AI 可观测性:监控用户输入 → Prompt → LLM 调用 → Tool Call → 多轮推理 → 最终输出
AI 可观测性的 4 个核心维度:
1. Prompt 追踪:记录和追踪所有 Prompt(包括动态生成的)2. Tool Call 追踪:监控 Agent 调用的所有外部工具3. Trace 链路追踪:完整的调用链路,从输入到输出4. Token 追踪:Token 消耗、成本、延迟的实时监控
这 4 个维度缺一不可。缺任何一个,你的 AI 系统就是一个「昂贵的黑盒」。
二、维度 1:Prompt 追踪——你的 AI 在「想」什么?
1、为什么 Prompt 追踪如此重要?
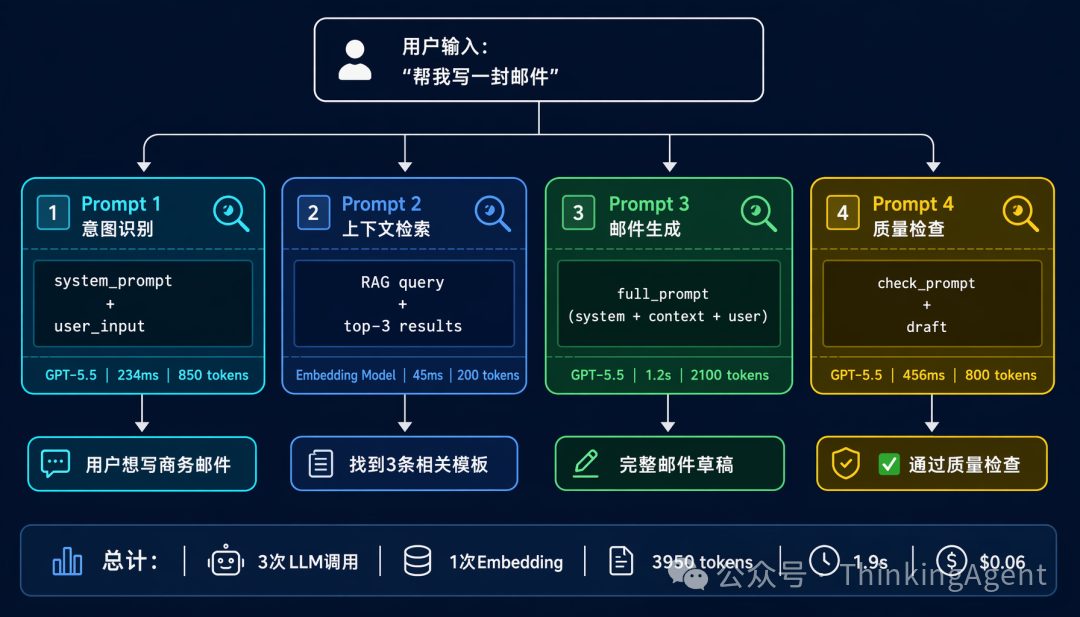
一个典型的 AI 应用,一次用户请求可能生成多个 Prompt:
用户输入:"帮我写一封邮件"↓Prompt 1: 意图识别(判断用户想做什么)↓Prompt 2: 上下文检索(从知识库找相关信息)↓Prompt 3: 邮件生成(根据意图和上下文生成邮件)↓Prompt 4: 质量检查(检查邮件是否符合要求)↓最终输出:一封完整的邮件
如果最终输出的邮件有问题,你如何定位是哪个 Prompt 出了问题?
没有 Prompt 追踪,你只能猜测。有了 Prompt 追踪,你可以精确定位。
2、Prompt 追踪的核心要素
每个 Prompt 应该记录:
prompt_trace:id: "prompt_abc123" # 唯一标识timestamp: "2026-06-18T10:23:45Z"parent_id: "trace_xyz789" # 所属的 Trace ID# Prompt 内容system_prompt: "你是一个专业的邮件助手..."user_prompt: "用户原始输入"full_prompt: "最终发送给 LLM 的完整 Prompt"# 模型调用model: "gpt-5.5"temperature: 0.7max_tokens: 2000# LLM 响应response: "LLM 的完整输出"finish_reason: "stop" # 或 "length"、"content_filter"# 性能指标latency_ms: 1234tokens_input: 850tokens_output: 420# 上下文metadata:user_id: "user_12345"session_id: "session_67890"feature_flag: "new_email_template_v2"
3、实战:用 Langfuse 实现 Prompt 追踪
Langfuse 是目前最流行的开源 AI 可观测性平台。下面是一个完整的示例:
from langfuse import Langfusefrom openai import OpenAI# 初始化langfuse = Langfuse(public_key="pk-lf-...",secret_key="sk-lf-...",host="https://cloud.langfuse.com")openai = OpenAI()def generate_email(user_input: str, user_id: str):# 创建 Tracetrace = langfuse.trace(name="email_generation",user_id=user_id,metadata={"source": "web"})# 追踪 Prompt 1: 意图识别span1 = trace.span(name="intent_detection")intent_prompt = f"判断用户意图:{user_input}"response1 = openai.chat.completions.create(model="gpt-5.5",messages=[{"role": "user", "content": intent_prompt}])span1.end(output=response1.choices[0].message.content,metadata={"tokens_input": response1.usage.prompt_tokens,"tokens_output": response1.usage.completion_tokens})intent = response1.choices[0].message.content# 追踪 Prompt 2: 邮件生成span2 = trace.span(name="email_drafting")email_prompt = f"根据意图 '{intent}' 生成邮件"response2 = openai.chat.completions.create(model="gpt-5.5",messages=[{"role": "user", "content": email_prompt}])span2.end(output=response2.choices[0].message.content,metadata={"tokens_input": response2.usage.prompt_tokens,"tokens_output": response2.usage.completion_tokens})email = response2.choices[0].message.content# 记录最终输出trace.update(output=email,metadata={"total_spans": 2})return email
4、Prompt 追踪的最佳实践
记录完整 Prompt:不要只记录用户输入,要记录最终发送给 LLM 的完整 Prompt(包括 system prompt、few-shot examples)
版本管理:Prompt 模板要有版本号,方便追踪哪个版本效果好
A/B 测试追踪:在 metadata 中记录实验分组,方便后续分析
敏感信息脱敏:用户输入可能包含个人信息,记得脱敏后再记录
三、维度 2:Tool Call 追踪——你的 Agent 在「做」什么?
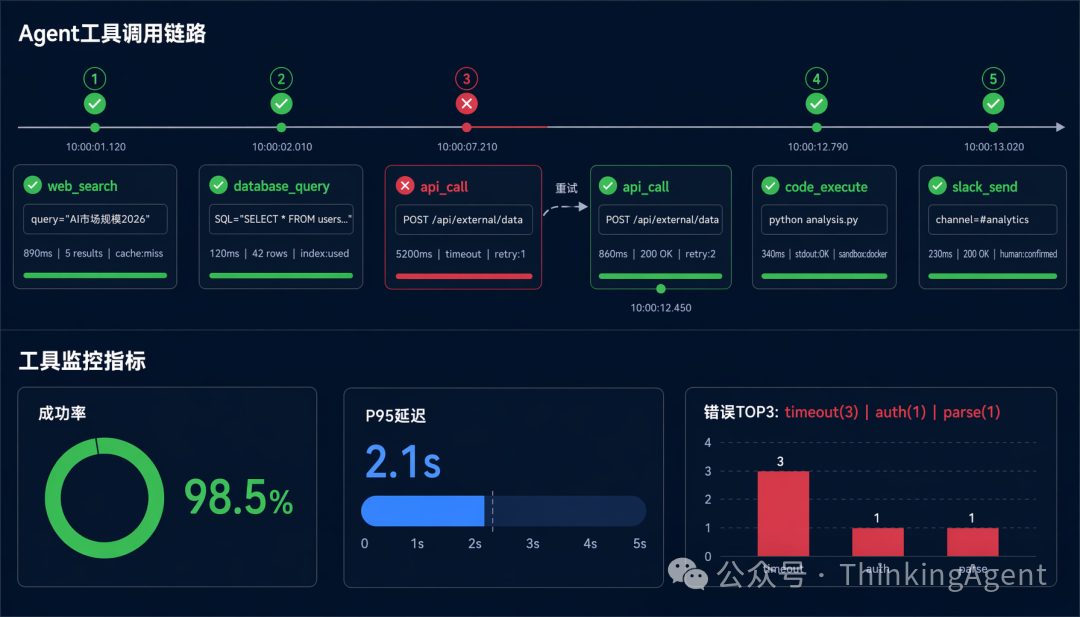
1、Agent 的工具调用链
2026 年的 AI Agent 不再是简单的「问答机器」。它们会:
搜索互联网获取实时信息
调用 API 查询数据库
执行代码进行计算
操作浏览器完成复杂任务
一个 Agent 任务可能调用 5-20 个工具。如果没有追踪,你根本不知道它在做什么。
2、Tool Call 追踪的核心要素
tool_call_trace:id: "tool_call_def456"timestamp: "2026-06-18T10:23:46Z"parent_id: "span_abc123" # 所属的 Span# 工具信息tool_name: "web_search"tool_version: "2.1.0"# 调用参数input:query: "2026年AI市场规模"num_results: 5date_range: "last_month"# 工具响应output:success: trueresults: [{"title": "...", "url": "...", "snippet": "..."},# ... 更多结果]result_count: 5# 性能指标latency_ms: 890retries: 0# 错误信息(如果有)error: null# 上下文metadata:cache_hit: falserate_limited: false
3、实战:追踪 Agent 的工具调用
from langfuse import Langfusefrom typing import Callable, Anylangfuse = Langfuse()def tracked_tool_call(trace, tool_name: str, func: Callable, **kwargs):"""装饰器:自动追踪工具调用"""# 创建 Spanspan = trace.span(name=f"tool_call:{tool_name}",input=kwargs)try:# 执行工具result = func(**kwargs)# 记录成功span.end(output=result,metadata={"success": True})return resultexcept Exception as e:# 记录失败span.end(output=None,metadata={"success": False,"error_type": type(e).__name__,"error_message": str(e)})raise# 使用示例def search_web(query: str, num_results: int = 5):# 实际的搜索逻辑return {"results": [...], "count": num_results}# 在 Agent 中调用trace = langfuse.trace(name="research_agent")results = tracked_tool_call(trace,"web_search",search_web,query="AI market size 2026",num_results=5)
4、Tool Call 追踪的关键指标
成功率:工具调用的成功率应该 > 99%
延迟分布:P50、P95、P99 延迟,识别慢工具
错误类型分布:哪些工具最容易出错?
调用频率:哪些工具被调用最多?是否有优化空间?
5、工具调用的常见陷阱
陷阱 | 表现 | 解决方案 |
|---|---|---|
工具超时 | Agent 卡在某个工具调用 | 设置超时 + 重试机制 |
工具幻觉 | Agent 调用不存在的工具 | 工具注册表 + 严格校验 |
工具滥用 | 简单任务调用过多工具 | 优化工具选择逻辑 |
工具依赖 | 工具 A 失败导致工具 B 也失败 | 记录依赖关系 + 级联错误处理 |
四、维度 3:Trace 链路追踪——完整的「故事线」
1、什么是 Trace?
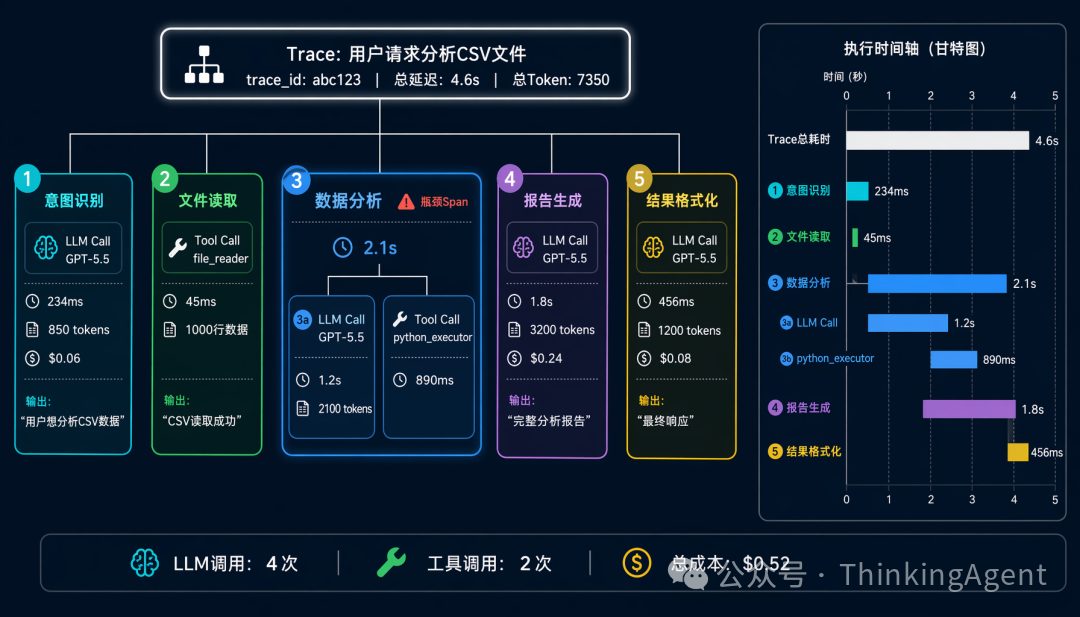
Trace 是一次完整用户请求的全部调用链路。
类比:
传统软件:一个 HTTP 请求 → 多个微服务调用 → 数据库查询 → 响应
AI 系统:一个用户输入 → 多个 Prompt → 多次 LLM 调用 → 多个 Tool Call → 最终输出
Trace 让你看到完整的「故事线」,而不是零散的片段。
2、Trace 的层级结构
Trace: 用户请求 "帮我分析这个 CSV 文件"├── Span 1: 意图识别│ ├── LLM Call: GPT-5.5 (234ms, 850 tokens)│ └── Output: "用户想分析 CSV 数据"├── Span 2: 文件读取│ ├── Tool Call: file_reader (45ms)│ └── Output: CSV 内容 (1000 行)├── Span 3: 数据分析│ ├── LLM Call: GPT-5.5 (1.2s, 2100 tokens)│ ├── Tool Call: python_executor (890ms)│ └── Output: 统计结果 + 图表├── Span 4: 报告生成│ ├── LLM Call: GPT-5.5 (1.8s, 3200 tokens)│ └── Output: 完整分析报告└── Span 5: 结果格式化├── LLM Call: GPT-5.5 (456ms, 1200 tokens)└── Output: 最终响应总计:4 次 LLM 调用,2 次工具调用,总延迟 4.6s,总 Token 7350
3、Trace 的核心价值
问题定位:用户说「响应太慢」,Trace 告诉你慢在哪个环节
性能优化:发现哪个 Span 耗时最长,针对性优化
成本分析:每次请求花了多少 Token,哪些 Prompt 最贵
质量评估:对比成功和失败的 Trace,找出差异
4、实战:构建完整的 Trace
from langfuse import Langfuseimport timelangfuse = Langfuse()def analyze_csv(user_input: str, file_path: str, user_id: str):# 创建 Tracetrace = langfuse.trace(name="csv_analysis",user_id=user_id,metadata={"input": user_input,"file_path": file_path})start_time = time.time()# Span 1: 意图识别with trace.span(name="intent_detection") as span1:intent = detect_intent(user_input)span1.update(output=intent)# Span 2: 文件读取with trace.span(name="file_reading") as span2:csv_data = read_csv_file(file_path)span2.update(output={"rows": len(csv_data), "columns": len(csv_data.columns)},metadata={"file_size_mb": get_file_size(file_path)})# Span 3: 数据分析with trace.span(name="data_analysis") as span3:analysis_prompt = f"分析以下数据:\n{csv_data.head()}"analysis = call_llm(analysis_prompt)# 子 Span: 代码执行with span3.span(name="code_execution") as sub_span:code = extract_code(analysis)result = execute_python(code)sub_span.update(output=result)span3.update(output=analysis)# Span 4: 报告生成with trace.span(name="report_generation") as span4:report = generate_report(analysis, result)span4.update(output=report)# Span 5: 结果格式化with trace.span(name="formatting") as span5:final_output = format_response(report)span5.update(output=final_output)# 更新 Tracetotal_time = time.time() - start_timetrace.update(output=final_output,metadata={"total_latency_ms": int(total_time * 1000),"total_spans": 5,"total_llm_calls": 4})return final_output
5、Trace 分析的高级技巧
1)对比分析
# 对比成功和失败的 Tracesuccessful_traces = langfuse.fetch_traces(name="csv_analysis",metadata={"status": "success"},limit=100)failed_traces = langfuse.fetch_traces(name="csv_analysis",metadata={"status": "failed"},limit=100)# 分析差异# 成功的 Trace 平均 3 次 LLM 调用# 失败的 Trace 平均 7 次 LLM 调用(可能在重试)
2)性能瓶颈识别
# 找出最慢的 Spantraces = langfuse.fetch_traces(name="csv_analysis", limit=1000)span_latencies = {}for trace in traces:for span in trace.spans:if span.name not in span_latencies:span_latencies[span.name] = []span_latencies[span.name].append(span.latency_ms)# 计算每个 Span 的平均延迟for span_name, latencies in span_latencies.items():avg = sum(latencies) / len(latencies)p95 = sorted(latencies)[int(len(latencies) * 0.95)]print(f"{span_name}: avg={avg}ms, p95={p95}ms")
3)成本归因
# 计算每个 Span 的 Token 消耗和成本trace = langfuse.fetch_trace(trace_id="xxx")total_cost = 0for span in trace.spans:if span.type == "llm":tokens = span.metadata.get("tokens_input", 0) + span.metadata.get("tokens_output", 0)cost = calculate_cost(span.model, tokens)total_cost += costprint(f"{span.name}: {tokens} tokens, ${cost:.4f}")print(f"Total cost: ${total_cost:.4f}")
五、维度 4:Token 追踪——你的 AI 花了多少钱?
1、为什么 Token 追踪如此重要?
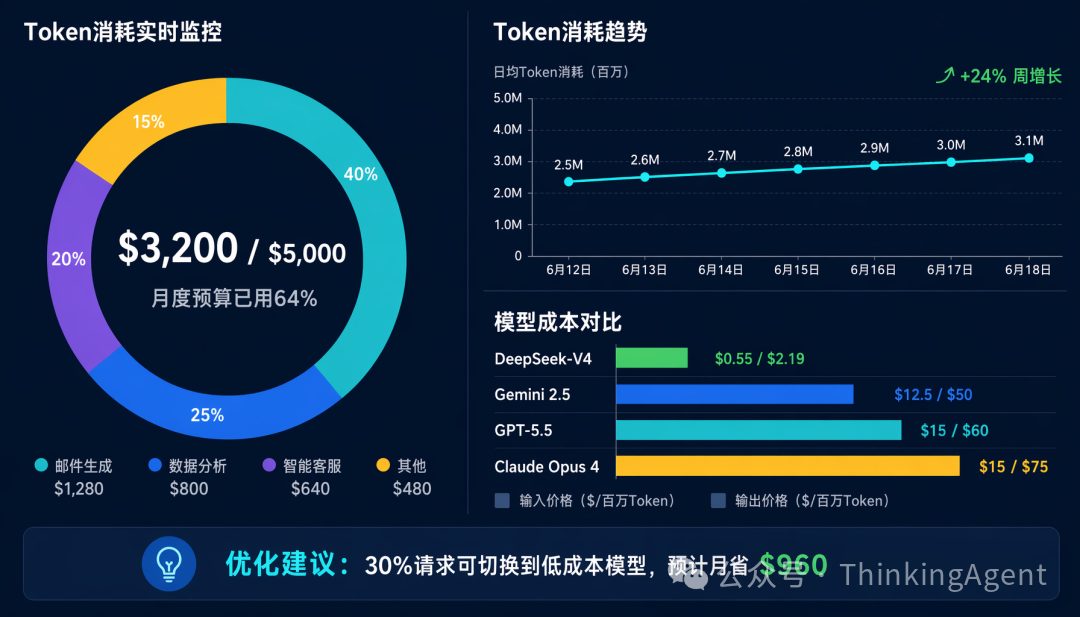
2026 年的 LLM 价格:
模型 | 输入价格 ($/1M tokens) | 输出价格 ($/1M tokens) |
|---|---|---|
GPT-5.5 | $15 | $60 |
Claude Opus 4 | $15 | $75 |
Gemini 2.5 Ultra | $12.50 | $50 |
DeepSeek-V4 | $0.55 | $2.19 |
一个复杂 Agent 任务可能消耗 10,000+ tokens,成本 $0.5-$1。
如果你的系统每天处理 10,000 个请求:
低成本模型:$50-$100/天
高成本模型:$5,000-$10,000/天
没有 Token 追踪,你只能在月底收到账单时才知道花了多少钱。有了 Token 追踪,你可以实时监控、预警、优化。
2、Token 追踪的核心指标
token_metrics:# 实时指标tokens_per_minute: 125000cost_per_minute: $8.50# 按用户/会话/功能分组tokens_by_user:user_123: 45000 tokens ($2.70)user_456: 38000 tokens ($2.28)tokens_by_feature:email_generation: 85000 tokens ($5.10)csv_analysis: 125000 tokens ($7.50)chat: 40000 tokens ($2.40)# 趋势分析daily_tokens:2026-06-16: 2.5M tokens ($150)2026-06-17: 2.8M tokens ($168)2026-06-18: 3.1M tokens ($186) # +10% 增长# 预算控制monthly_budget: $5000monthly_spent: $3200monthly_remaining: $1800projected_end_of_month: $4800 # 基于当前趋势
3、实战:构建 Token 追踪系统
from langfuse import Langfusefrom dataclasses import dataclassfrom typing import Dictimport jsonlangfuse = Langfuse()class TokenUsage:model: strinput_tokens: intoutput_tokens: intcost: floatclass TokenTracker:def __init__(self):self.usage_by_user: Dict[str, TokenUsage] = {}self.usage_by_feature: Dict[str, TokenUsage] = {}self.daily_usage: Dict[str, TokenUsage] = {}def record_usage(self, user_id: str, feature: str, model: str,input_tokens: int, output_tokens: int):"""记录 Token 使用"""cost = self._calculate_cost(model, input_tokens, output_tokens)usage = TokenUsage(model=model,input_tokens=input_tokens,output_tokens=output_tokens,cost=cost)# 按用户聚合if user_id not in self.usage_by_user:self.usage_by_user[user_id] = TokenUsage(model, 0, 0, 0)self.usage_by_user[user_id].input_tokens += input_tokensself.usage_by_user[user_id].output_tokens += output_tokensself.usage_by_user[user_id].cost += cost# 按功能聚合if feature not in self.usage_by_feature:self.usage_by_feature[feature] = TokenUsage(model, 0, 0, 0)self.usage_by_feature[feature].input_tokens += input_tokensself.usage_by_feature[feature].output_tokens += output_tokensself.usage_by_feature[feature].cost += cost# 按天聚合today = datetime.now().strftime("%Y-%m-%d")if today not in self.daily_usage:self.daily_usage[today] = TokenUsage(model, 0, 0, 0)self.daily_usage[today].input_tokens += input_tokensself.daily_usage[today].output_tokens += output_tokensself.daily_usage[today].cost += cost# 发送到 Langfuselangfuse.score(name="token_cost",value=cost,metadata={"user_id": user_id,"feature": feature,"model": model})def _calculate_cost(self, model: str, input_tokens: int, output_tokens: int) -> float:"""计算成本"""pricing = {"gpt-5.5": {"input": 15, "output": 60}, # $/1M tokens"claude-opus-4": {"input": 15, "output": 75},"gemini-2.5-ultra": {"input": 12.5, "output": 50},"deepseek-v4": {"input": 0.55, "output": 2.19},}if model not in pricing:return 0input_cost = (input_tokens / 1_000_000) * pricing[model]["input"]output_cost = (output_tokens / 1_000_000) * pricing[model]["output"]return input_cost + output_costdef get_daily_report(self):"""生成每日报告"""today = datetime.now().strftime("%Y-%m-%d")usage = self.daily_usage.get(today, TokenUsage("", 0, 0, 0))return {"date": today,"total_tokens": usage.input_tokens + usage.output_tokens,"total_cost": usage.cost,"by_feature": {feature: {"tokens": u.input_tokens + u.output_tokens,"cost": u.cost}for feature, u in self.usage_by_feature.items()}}# 使用示例tracker = TokenTracker()# 在每次 LLM 调用后记录tracker.record_usage(user_id="user_123",feature="email_generation",model="gpt-5.5",input_tokens=850,output_tokens=420)# 查看报告report = tracker.get_daily_report()print(json.dumps(report, indent=2))
4、Token 优化策略
1)模型选择优化
不是所有任务都需要最贵的模型:
def select_model(task_complexity: str) -> str:"""根据任务复杂度选择模型"""if task_complexity == "high":return "gpt-5.5" # $15/$60elif task_complexity == "medium":return "gemini-2.5-flash" # $0.30/$1.20else:return "deepseek-v4" # $0.55/$2.19
2)Prompt 缓存
相同的 Prompt 前缀可以缓存,避免重复计算:
# 优化前:每次都发送完整的 system promptprompt1 = system_prompt + user_input1 # 2000 tokensprompt2 = system_prompt + user_input2 # 2000 tokens# 优化后:使用 Prompt 缓存# system_prompt 只需计算一次,后续调用享受 50% 折扣
3)输出长度控制
# 优化前:不限制输出长度response = call_llm(prompt) # 可能输出 2000 tokens# 优化后:根据任务设置 max_tokensresponse = call_llm(prompt, max_tokens=500) # 最多 500 tokens
六、完整的 AI 可观测性架构
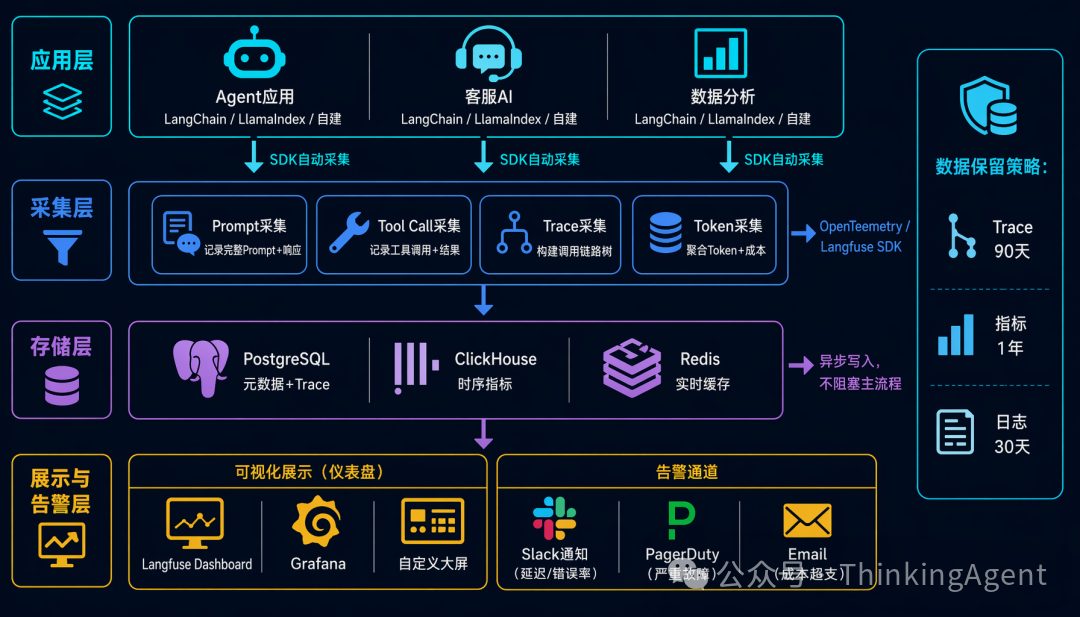
1、4 个维度的整合
用户请求↓[Trace 链路追踪] ← 贯穿整个流程↓[Span 1: Prompt 追踪]- 记录完整 Prompt- 追踪 LLM 调用↓[Span 2: Tool Call 追踪]- 记录工具调用- 追踪执行结果↓[Span 3: Prompt 追踪]- 记录后续 Prompt↓[Token 追踪] ← 聚合所有 Span 的 Token 消耗↓最终响应
2、技术栈选择
开源方案:
1)Langfuse(推荐)
开源 + 云托管
支持 Prompt、Tool Call、Trace、Token 全维度
易于集成,Python/JS SDK 完善
适合中小团队
2)OpenTelemetry + 自定义
完全开源,高度可定制
需要自己搭建存储和可视化
适合有基础设施团队的大公司
3、生产环境部署清单
# 1. 基础设施observability_stack:- langfuse: v2.0+ # 核心追踪平台- postgresql: 15+ # 元数据存储- clickhouse: 23+ # 时序数据存储- redis: 7+ # 缓存- grafana: 10+ # 可视化(可选)# 2. 集成点integration_points:- llm_provider: OpenAI/Anthropic/自建网关- agent_framework: LangChain/LlamaIndex/自建- tool_registry: MCP Server- alerting: Slack/PagerDuty/Email# 3. 监控告警alerts:- name: "高延迟告警"condition: "p95_latency > 5000ms"action: "notify_slack"- name: "高错误率告警"condition: "error_rate > 5%"action: "notify_pagerduty"- name: "成本超支告警"condition: "daily_cost > budget * 0.8"action: "notify_email"- name: "Token 异常告警"condition: "tokens_per_request > 10000"action: "notify_slack"# 4. 数据保留retention:traces: 90 daysmetrics: 1 yearlogs: 30 days
七、实战案例:一个完整的可观测性改造
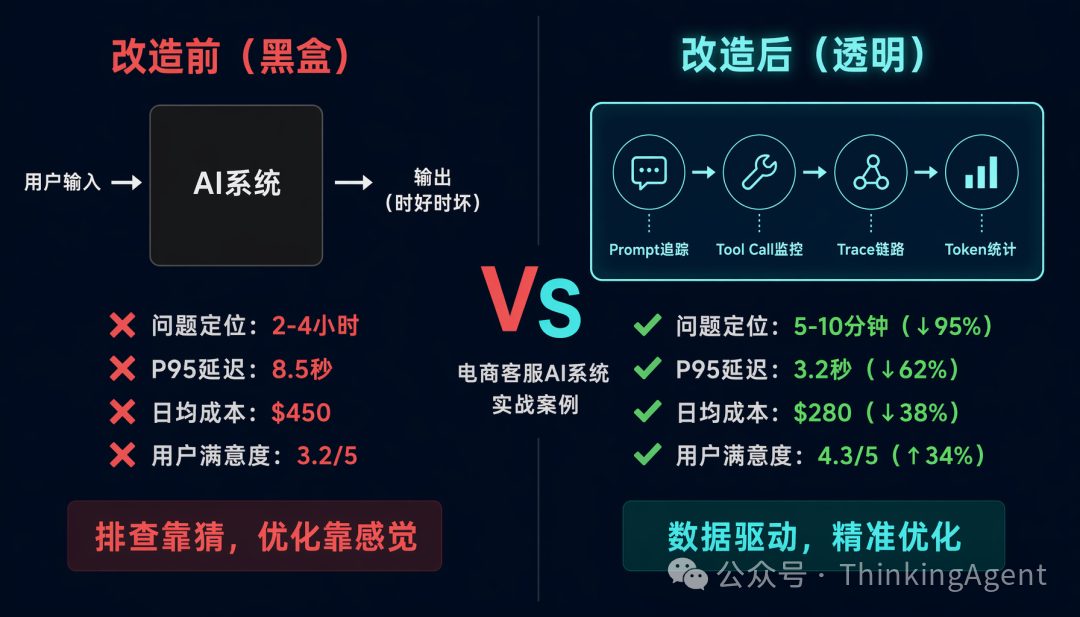
1、背景
一个电商客服 AI 系统,用户反馈「有时候回答很慢,有时候回答错误」。
2、改造前的问题
没有 Prompt 追踪:不知道发给 LLM 的是什么
没有 Tool Call 追踪:不知道 Agent 调了哪些工具
没有 Trace:不知道完整调用链路
没有 Token 追踪:不知道花了多少钱
3、改造方案
Step 1: 接入 Langfuse
from langfuse import Langfusefrom langfuse.callback import CallbackHandlerlangfuse = Langfuse()handler = CallbackHandler()# 在 LangChain 中集成chain.invoke(input, config={"callbacks": [handler]})
Step 2: 添加自定义追踪
# 追踪关键业务指标trace = langfuse.trace(name="customer_service",metadata={"customer_id": customer_id,"product_category": category,"issue_type": issue_type})# 记录用户满意度trace.score(name="user_satisfaction",value=4.5, # 1-5 分comment="用户评价")
Step 3: 构建监控仪表盘
# 关键指标dashboard_metrics = {"请求量": "count(traces) by hour","平均延迟": "avg(latency_ms)","P95 延迟": "percentile(latency_ms, 95)","错误率": "count(error_traces) / count(traces)","日均成本": "sum(token_cost) by day","用户满意度": "avg(user_satisfaction_score)"}
4、改造后的成果
指标 | 改造前 | 改造后 | 改进 |
|---|---|---|---|
问题定位时间 | 2-4 小时 | 5-10 分钟 | 95% ↓ |
P95 延迟 | 8.5s | 3.2s | 62% ↓ |
日均成本 | $450 | $280 | 38% ↓ |
用户满意度 | 3.2/5 | 4.3/5 | 34% ↑ |
关键发现:
慢响应的原因:某个 Tool Call(查询订单系统)P95 延迟 4.2s,优化后降至 0.8s
错误回答的原因:Prompt 模板中的 few-shot examples 过时,更新后准确率提升 25%
成本优化的机会:30% 的请求可以用更便宜的模型处理,切换后成本降低 40%
八、最佳实践:AI 可观测性的 10 条原则
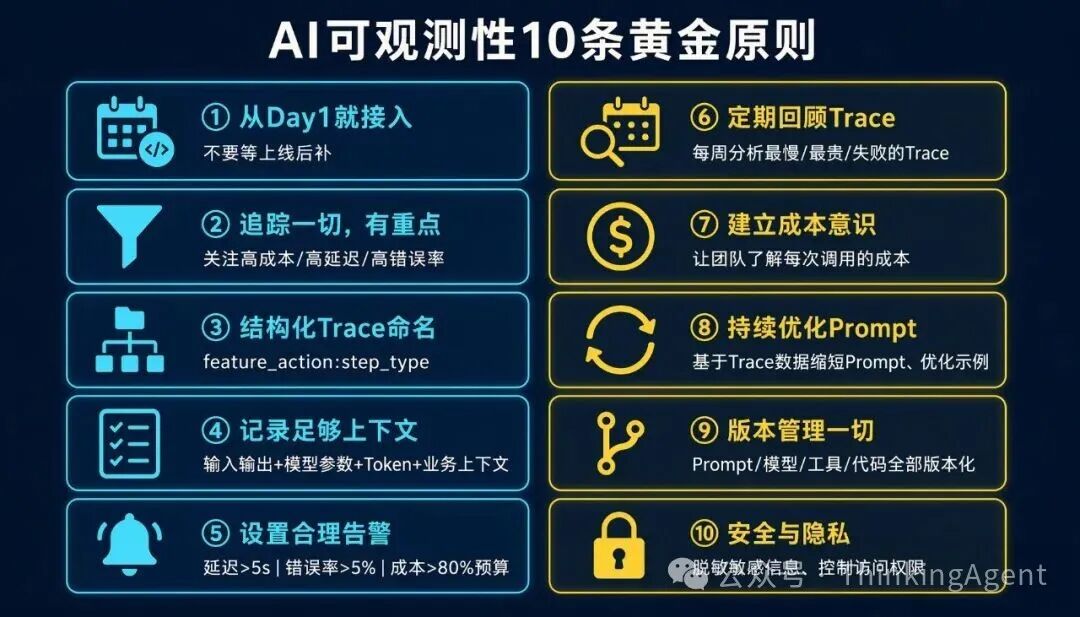
1、从第一天就接入可观测性
不要等到上线后才补。可观测性应该是开发流程的一部分,而不是事后补救。
2、追踪一切,但要有重点
追踪所有 LLM 调用和 Tool Call,但重点关注:
高成本的功能
高延迟的环节
高错误率的路径
3、结构化你的 Trace
使用清晰的命名规范:
trace_name: feature_actionspan_name: step_type例:trace: csv_analysisspan: intent_detection:llmspan: file_reading:toolspan: data_analysis:llm+tool
4、记录足够的上下文
每个 Span 都应该记录:
输入和输出
模型和参数
Token 消耗
延迟
错误信息(如果有)
业务上下文(用户 ID、会话 ID、功能版本)
5、设置合理的告警
不要告警太多(告警疲劳),也不要告警太少(漏掉问题):
延迟:P95 > 5s
错误率:> 5%
成本:超过预算 80%
Token:单次请求 > 10,000 tokens
6、定期回顾 Trace
每周花时间回顾:
最慢的 10 个 Trace
最贵的 10 个 Trace
失败的 Trace
7、建立成本意识
让团队了解成本:
每个功能的日均成本
每个用户的平均成本
每次 LLM 调用的平均成本
8、持续优化 Prompt
基于 Trace 数据优化 Prompt:
缩短不必要的 Prompt
优化 few-shot examples
调整 temperature 等参数
9、版本管理
追踪所有变更:
Prompt 模板版本
模型版本
工具版本
代码版本
10、安全与隐私
脱敏敏感信息
控制数据访问权限
遵守数据保留政策
九、总结:从黑盒到透明
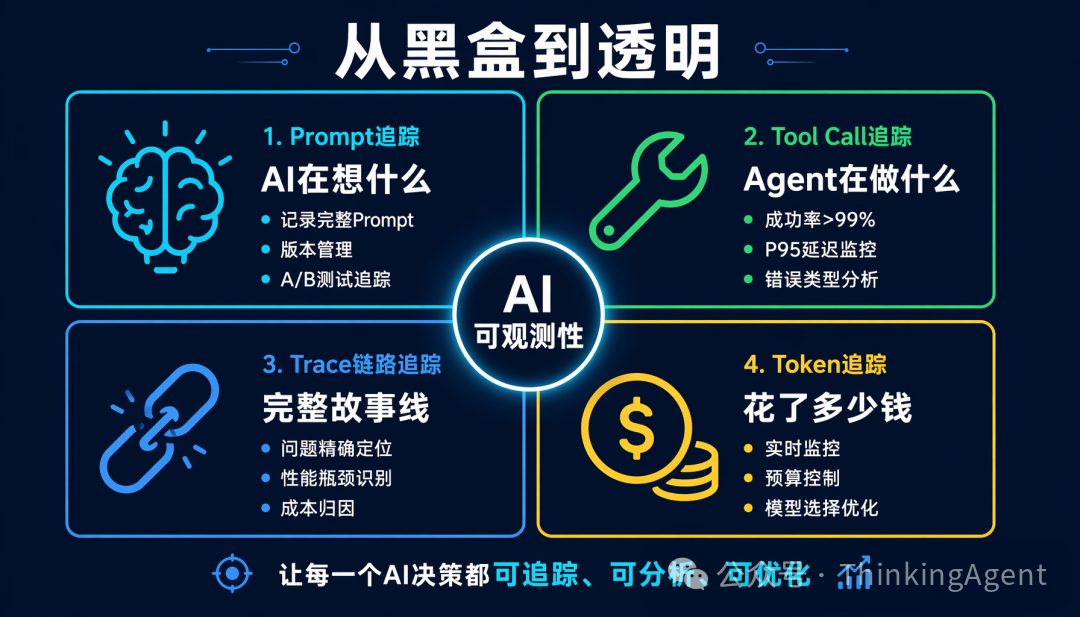
AI 可观测性不是可选项,而是必选项。
没有可观测性的 AI 系统:
问题定位靠猜
性能优化靠感觉
成本控制靠月底账单
质量改进靠用户反馈
有可观测性的 AI 系统:
问题定位靠数据(5 分钟找到根因)
性能优化靠分析(精准识别瓶颈)
成本控制靠实时监控(随时预警)
质量改进靠 A/B 测试(数据驱动决策)
记住这 4 个维度:
Prompt 追踪:你的 AI 在「想」什么
Tool Call 追踪:你的 Agent 在「做」什么
Trace 链路追踪:完整的「故事线」
Token 追踪:你的 AI 花了多少钱
从今天开始,让你的 AI 系统从黑盒变成透明。
>>>>
参考资料
Langfuse 官方文档(https://langfuse.com/docs)
LangSmith 官方文档(https://docs.smith.langchain.com)
OpenTelemetry for LLMs(https://opentelemetry.io/blog/2024/genai)
AI Trust OS: Continuous Governance for Autonomous AI(https://arxiv.org/abs/2604.04749)(2026.04)
Governance-Aware Agent Telemetry(https://arxiv.org/abs/2604.05119)(2026.04)
From Confident Closing to Silent Failure(https://arxiv.org/abs/2606.09863)(2026.06)
作者丨Knock
来源丨公众号:ThinkingAgent(ID:ThinkingAgent)
dbaplus社群欢迎广大技术人员投稿,投稿邮箱:editor@dbaplus.cn

本文转载自微信公众号「dbaplus社群」,查看原文。版权归原作者所有,如有侵权请联系删除。